The Challenge
A conversation today sparked a bit of a domino effect of thoughts. The question “How hard is it to make a risk platform for the construction industry?” brought to mind other conversations I’ve had:
- How hard is it to make a Contract administration platform?
- How hard is it to make a Health and Safety platform?
- How hard is it to make a Task management platform?
Solution to a different question
The answer to all the above is …… quite hard, but that’s probably because it’s not quite the right question. After all, the platforms I mentioned above, in their simplest form, can be distilled into a series of tables, some workflows and a nice UI. The real challenge of building a platform from scratch is the DevOps and back-end side of things; security, scalability, user management, data types and APIs. Maybe the right question is; how can I adapt existing platforms to be used in Construction.
This brings me to Airtable, a platform many people will be familiar with, but some might not be. Think of Airtable as the modern web based answer to Microsoft Access. A database and UI rolled into one, with all the trimmings of a modern SaaS platform. Let’s see how easy it would be to take the logic defined in the RICS Management of Risk guidance and apply it to Airtable (You could also chose to use the Uniclass Risk breakdown: RK Risk | Uniclass (thenbs.com)). To start with you can find a copy of the guidance notes at the link below:
⬇️ Management of Risk, 1st edition (rics.org)
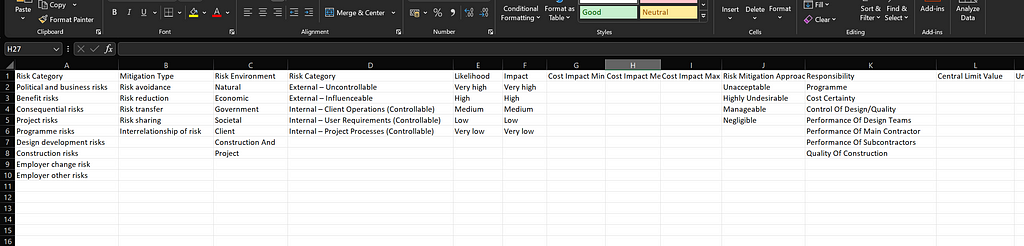
I have used Airtable on and off for a number of years and the best bit of wisdom I can pass down is that it is easier and quicker to scaffold your Airtable in Excel, ironic considering Airtable touts itself as an excel-killer. So I’m going to take the data points available in the RICS documentation and create a series of records which express every possibility for every column. A tip for anyone copying and pasting from PDFs, sometimes it’s worth pasting into Notepad first to maintain proper line breaks.
⬇️ Shift — RICS Risk Tables (Download)
Building
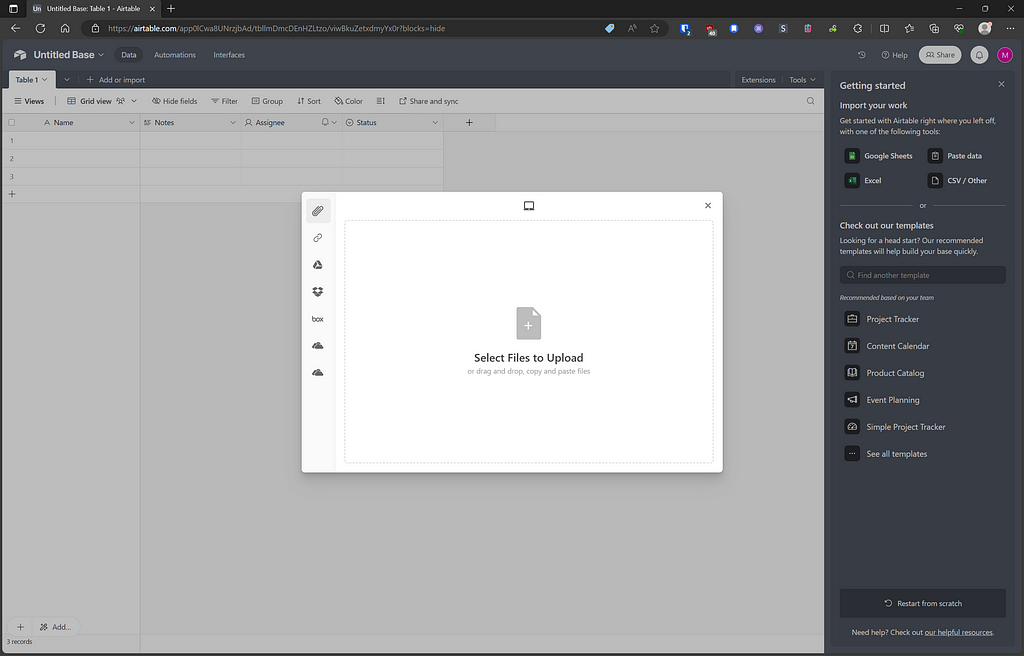
Now you have your table set up, we can head over to Airtable to set up the project, I’m going to use a pro account to take advantage of some of the workflow features and plugins there is a free trial available if you want to try it out for yourself. Then start by creating a new Base and importing your Excel workbook.
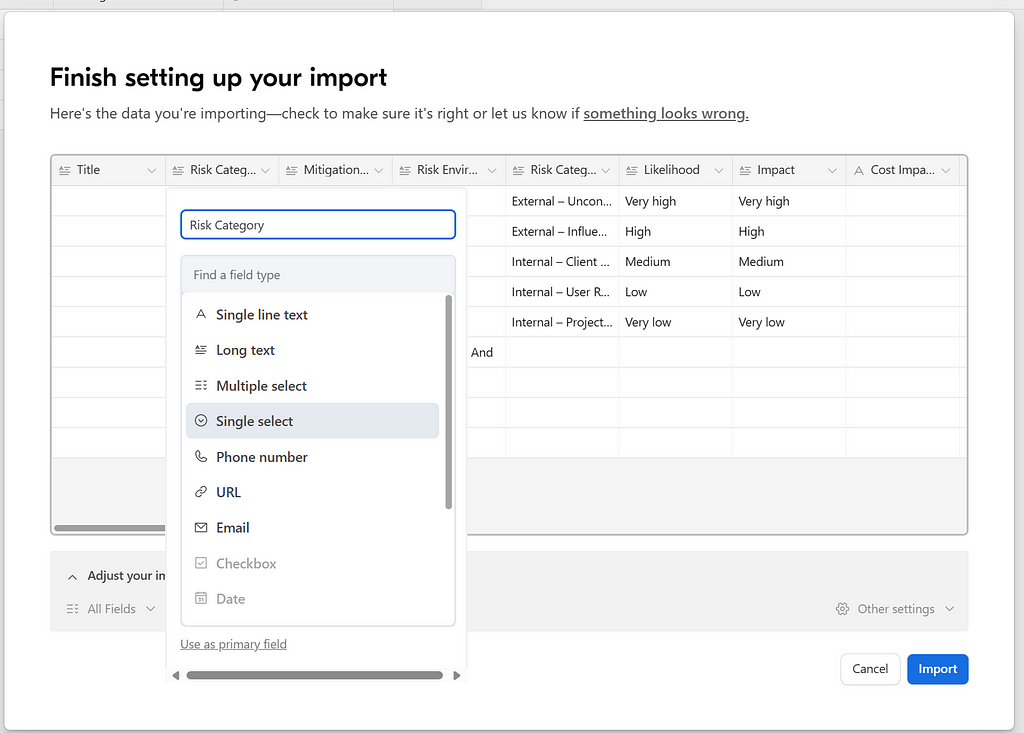
Once your table is loaded you can go through each of the columns and set them up with their relative field types. We’ll use a few for this demo:
- Short Text (for the Title)
- Long Text (for any descriptions)
- Single Select (for the drop down category select fields)
- Date (for the Impact date and any other date fields)
- Currency (for the Cost Impacts)
- Formula (for the Central Limit column)
Customising
Now I’ve imported the table, I’ve decided to make a few tweaks. I’ve changed the Likelihood and Impact columns to a 5 point rating instead of the drop-down for a few reasons; it’s easier to differentiate them from the other drop-downs, they are easier to interact with in the table, it creates a better visual cue for the user. I have also added an auto numbering column to create a unique ID for the rown and made sure all of the currency columns are in £ rather than the default $. By bringing in all of the options from the Excel sheet, all of my drop-down lists are automatically populated. I have also added a formula to calculate the Central Limit risk as defined by the RICS:
ΣPi × Ei × √(Ei² × Pi) × (1 − Pi) where Ei = The estimate for risk and Pi = The probability of risk occurring
Which in Airtable terms looks like (annoyingly the absence of IFERROR or LET in Airtable means you need to run the calculation twice to avoid errors):
IF(
 ISERROR(
  ([Cost Impact Mean] * ((Likelihood/5)-0.1)) + (1.3 * SQRT((POWER([Cost Impact Mean],2) * ((Likelihood/5)-0.1)) * (1 - ((Likelihood/5)-0.1))))),
  0,
  ([Cost Impact Mean] * ((Likelihood/5)-0.1)) + (1.3 * SQRT((POWER([Cost Impact Mean],2) * ((Likelihood/5)-0.1)) * (1 - ((Likelihood/5)-0.1)))
 )
)
Now for a little bit of lazy magic to create some sample data. I am going to use the Airtable API to grab the schema for my new table then send it to ChatGPT and ask it to produce a CSV of potential risks. To get the schema head to Airtable Developers to get a personal access token, then use:
curl "https://api.airtable.com/v0/meta/bases/{baseId}/tables" \
-H "Authorization: Bearer YOUR_TOKEN"
Where {baseId} is the section of the Airtable URL to access your table immediately after “https://airtable.com/”.
Your success with ChatGPT may very but with the simple prompt below I was able to generate 20 example risks that bear some resemblance to something realistic. After all we are just looking for data to test the system.
Using the following schema, create 20 construction project risks including relevant titles and mitigation descriptions:

{Schema Here}

Save the output as a valid CSV file
⬇️ Shift — Generated Risks (Download)
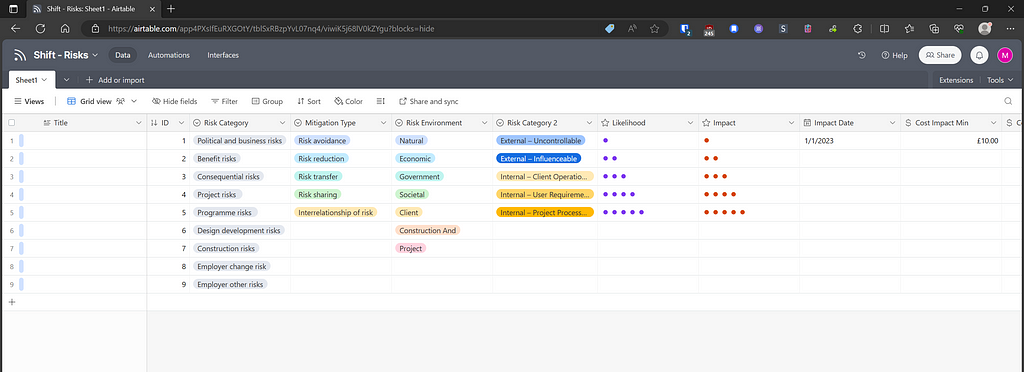
Once we’ve deleted out original template risks, we’re left with something that is starting to look pretty nice. You can see the finished article here on Airtable.

Automation
Since the RICS guidance states that different parties should be responsible depending on the “Responsibility” field I’ve added another column called “Assignee”, set it as a user type and created the following automation in Airtable:
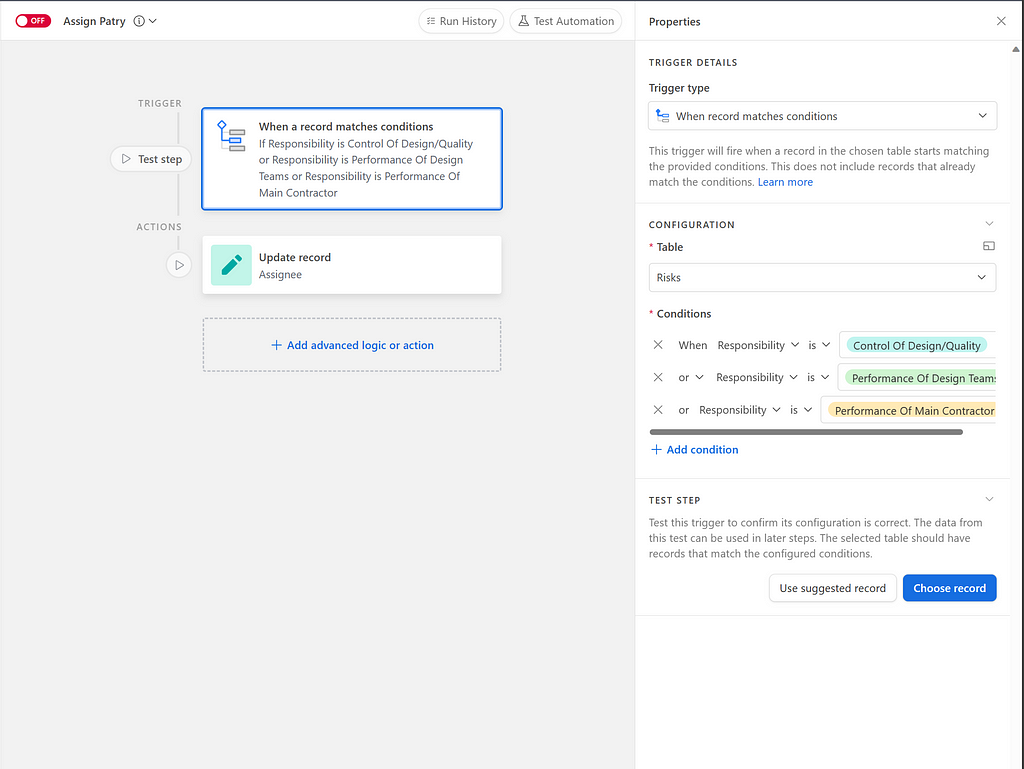
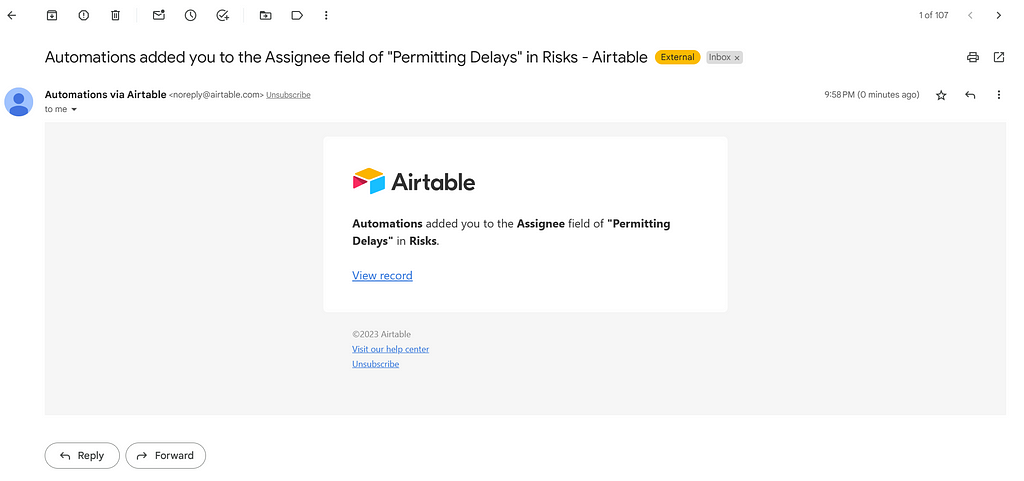
Since I’ve set up notifications on the field, the relevant assignee receives an email when they have been assigned to a risk. One of the things I like most about tools like Airtable is the linking. I can click on the link in the email and it will take me through to the record, where I can add comments, tag other users or upload attachments. All of this adds to the audit trail and keeps as much of the information in the system to avoid miscommunication later.
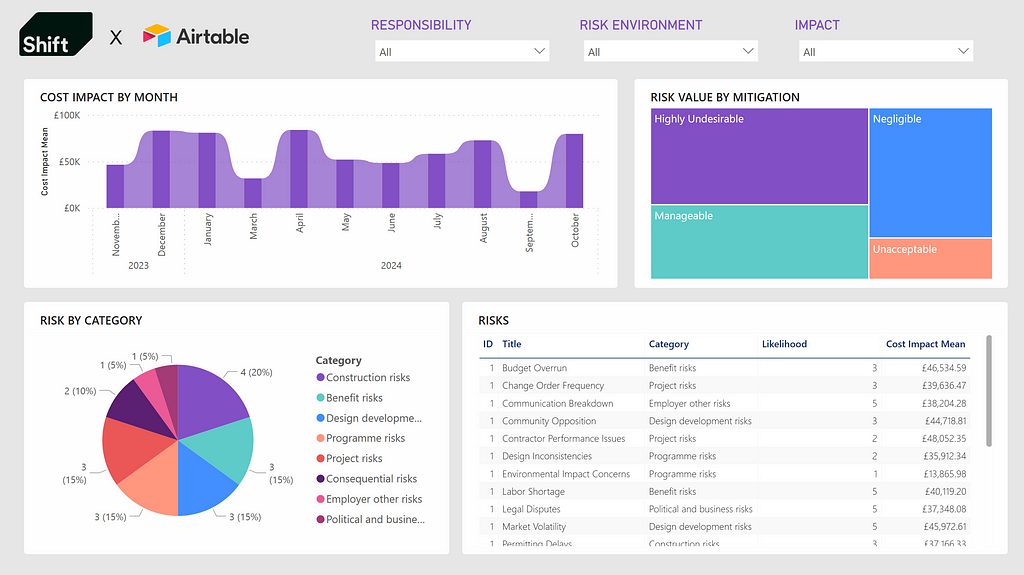
Dashboards
Since APIs come as standard in systems like Airtable, we can hook the data directly up to PowerBI using the List Records endpoint. Pulling down the data means we can make great dashboards to share with the team. Here is a link to the live dashboard linked to the new Risk Airtable: Shift PowerBI — Risk Dashboard.
While you’re in Airtable, rather than just using the table view, you can switch up to a kanban screen to run your weekly risk catch ups:
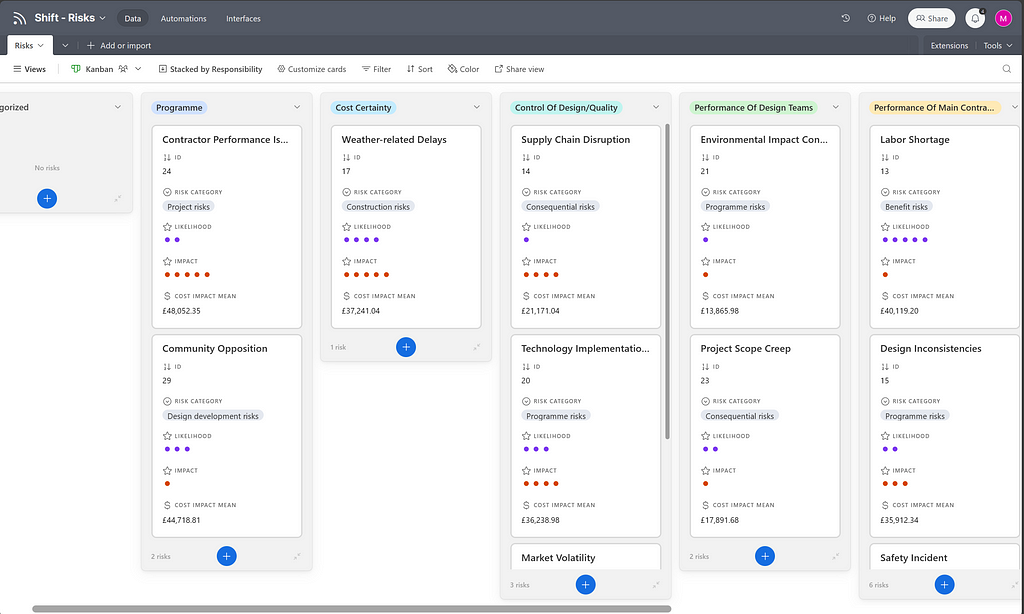
Any table in Airtable is also available in the app, so your team can add comments, or raise new risks wherever they are. This is another one of the big benefits of choosing more generic software tools, because they cater for a very wide audience they have more polished peripheral tools, like apps and APIs.
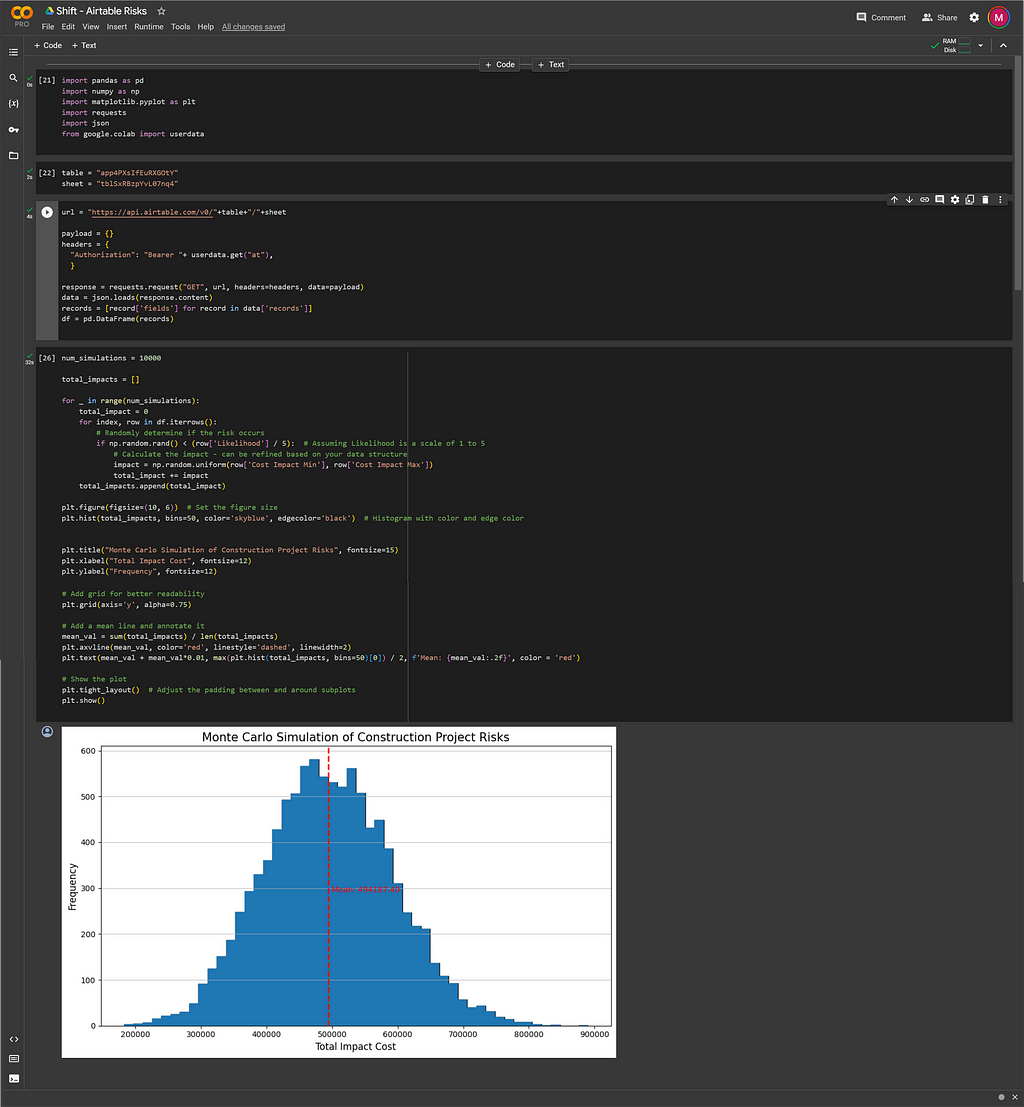
Monte Carlo
Finally onto the really powerful part. Now we have all of our data sitting on a cloud server we can set up some scripts to run Monte Carlo simulations in the cloud as well. Simulations like these can be pretty computer intensive so offloading them to the cloud can add great benefits:
- Run your simulations periodically automatically, in time for monthly or weekly reporting
- No need to burden individuals (often low powered) computers with the CPU intensive tasks
- Run multiple set-ups (eg. cross project, against programme etc.) easily
I’ve set up a Google Colab book which I’ve made publicly available here. This could also be ported to a cloud app on Google Cloud, Azure, AWS or any other system and be triggered by an API call, meaning that you could integrate it directly into one of you Airtable automations, or into a PowerBI refresh via Microsoft Power Automate.
So there you have it, a brisk guide through building you’re own applications in Airtable, let me know if you’ve got any other uses for these sorts of tools, or if you’ve tried the guide for yourself.
How to build your own Construction Risk tool (Monte Carlo, Dashboards, Collaboration) was originally published in Shift Construction on Medium, where people are continuing the conversation by highlighting and responding to this story.