Introduction
Weather-related delays significantly impact UK construction projects, accounting for up to 21% of total delays. Extreme temperatures affect concrete pouring and labor productivity, while high winds and rainfall create additional challenges. Despite meteorology being a data-rich field, its integration into construction decision-making remains surprisingly limited.
In 2022, I led a team at Project Hack 17, a construction hackathon, to tackle a brief from HS2 about weather tracking across their projects. The concept we ended up delivering was relatively straightforward, but added a lot of value, so much so that we ended up winning the competition. There was a lot of positive feedback from both HS2 and the other judges and yet nothing came of it, so I’ve decided to rebuild what we built for the hackathon, with a bit more consistency and more flexibility so that I can easily drop it in to any client with minimal effort.
Our PowerBI-based dashboard was designed to give management teams portfolio-level insights into weather-related risks and offer project teams an easily understandable one-page weather forecast dashboard tailored for construction needs. It’s not just about the forecast but also understanding past weather patterns. For instance, a prediction of 5mm/hr rain on Thursday means more when we recall calling off work last week at 4.5mm/hr. This context transforms data into actionable insights, emphasising the importance of both historical and predicted weather data in construction planning.
The data
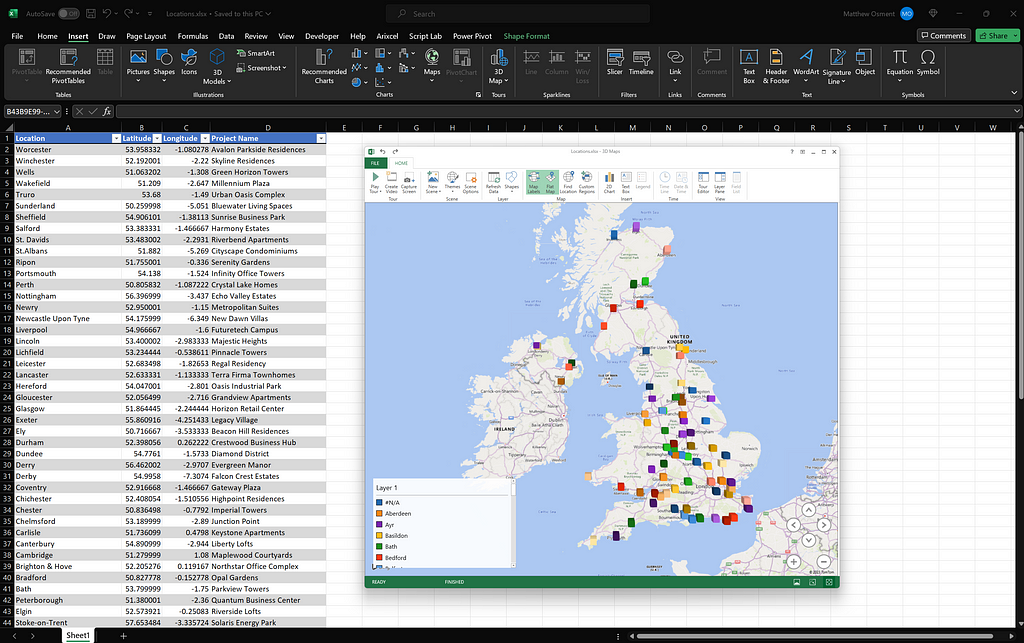
For my project portfolio, I needed sample data with latitude and longitude coordinates to display on a map. I managed to grab a list of 79 cities in the UK with their Lat & Lon at latlong.net, then I made a quick trip to ChatGPT to ask it for 79 fictional project names. Once all my location data was pasted into Excel I used the 3D Maps tool in Excel (excellent out of the box tool by the way) to validate my data.
The next step was sourcing weather data. During the hackathon, we had access to existing project records and used the Met-Office API for forecasts. However, for my fictional projects, I needed to find historical weather data. Open-Meteo emerged as a suitable option for several reasons:
- It offers a historical weather data store.
- It allows querying via latitude and longitude, unlike some APIs that only support specific weather stations.
- It’s free for non-commercial use, perfect for a demo, and the commercial use rate (€29/month) is quite affordable.
- It includes a forecasting endpoint, eliminating the need to integrate the Met-Office API.
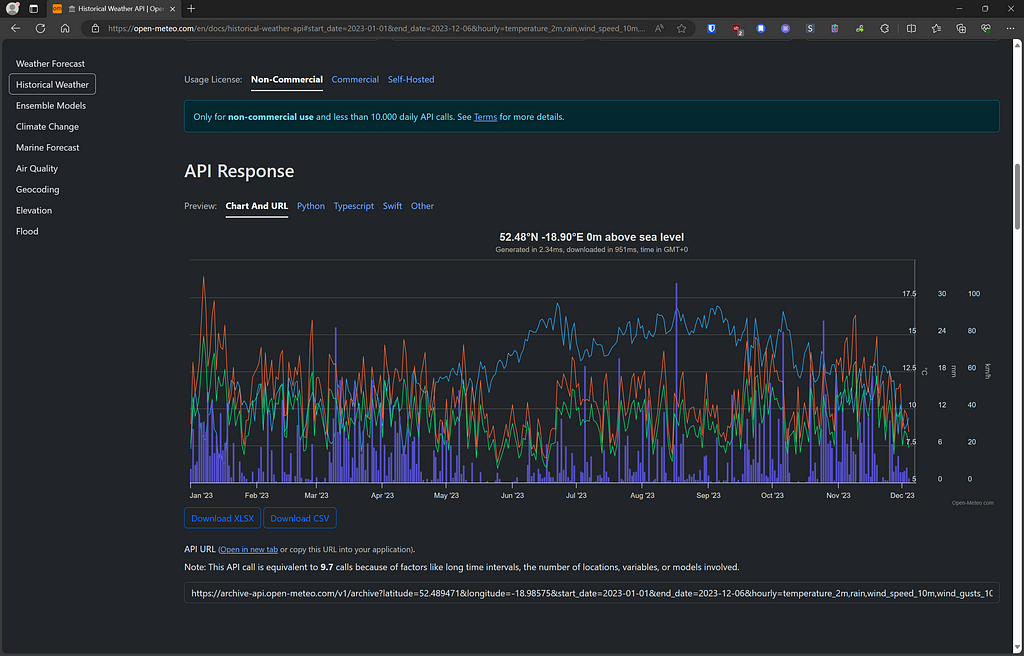
Using their demo tool I can see what the results look like for the 3 variables I’m interested in tracking; wind, rain & temperature. Here is a link to the results to see it in action for yourself.
The future forecast for Birmingham looks straightforward too:
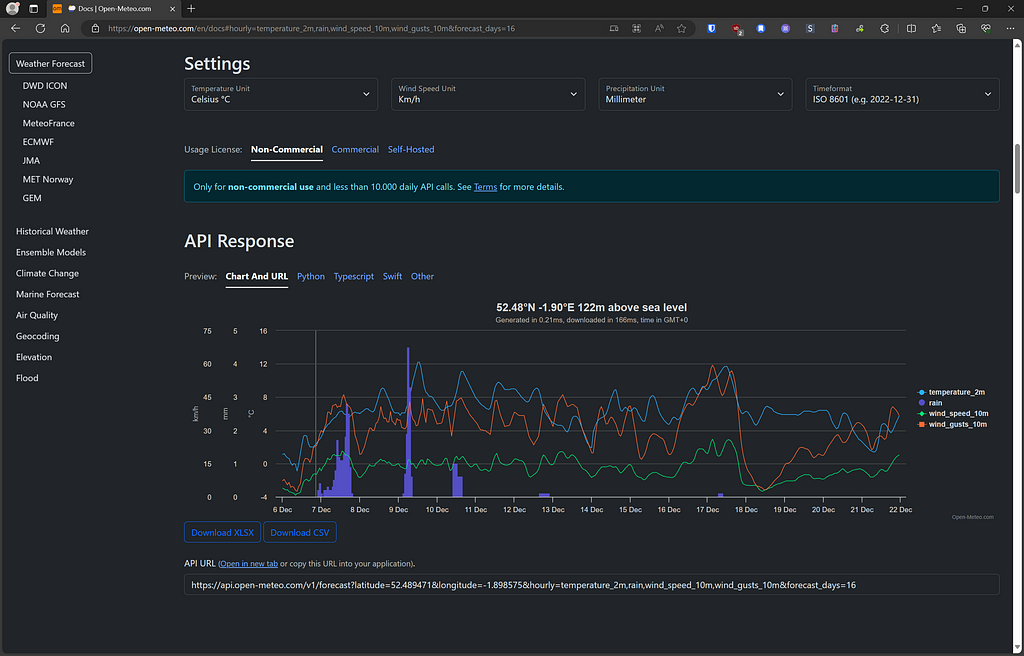
So lets see what happens when we pull that data into PowerBI, one of the useful things about the Open Meteo API is that it doesn’t require a key so all I have to do is query the endpoint to get the data.
https://api.open-meteo.com/v1/forecast?latitude=52.489471&longitude=-1.898575&hourly=temperature_2m,rain,wind_speed_10m,wind_gusts_10m&forecast_days=16&format=json&timeformat=unixtime
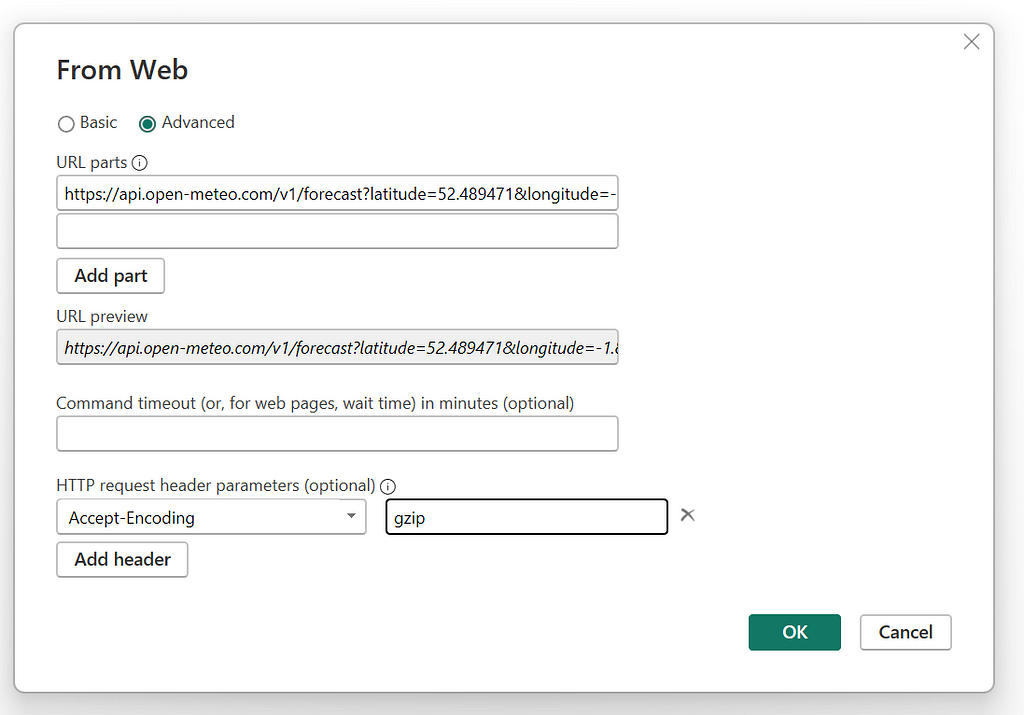
I’ll start by focusing on Birmingham and then convert the query into a function and apply it to all of my projects. Open up the Get Data > From Web window in PowerBI and past in the URL above. You can see a full list of parameters on open-meteo.com, but if I breakdown the URL it should be a bit clearer what we’re asking for:
https://api.open-meteo.com/v1/forecast?
  latitude=52.489471&
  longitude=-1.898575&
  hourly=temperature_2m,rain,wind_speed_10m,wind_gusts_10m&forecast_days=16&
  format=json&
  timeformat=unixtime
We also need to go to Advanced and set the Accept-Encoding header to gzip otherwise we get an error with the way that PowerBI tries to process the data.
At this point PowerQuery might try to guess some of the transformations you want to apply to the data, in my experience they are rarely helpful so just delete all of the steps after Source.
From there we needs to do a couple of non-standard functions to get the table nice and neat since the API provides an array for each set of data so you need to convert a bunch of lists into a table. The other interesting step is to convert the UNIX time into a datetime in PowerQuery, which is done by adding the UNIX number as seconds to 1/1/1970. The end result is the following query:
let
  Source = Json.Document(
    Web.Contents(
      "https://api.open-meteo.com/v1/forecast?latitude=52.489471&longitude=-1.898575&hourly=temperature_2m,rain,wind_speed_10m,wind_gusts_10m&forecast_days=16&timeformat=unixtime",
      [Headers = [#"Accept-Encoding" = "gzip"]]
    )
  ),
  hourly = Source[hourly],
  toTable = Table.FromColumns(
    {
      hourly[time],
      hourly[temperature_2m],
      hourly[rain],
      hourly[wind_speed_10m],
      hourly[wind_gusts_10m]
    },
    {"Time", "Temperature", "Rain", "Wind Speed", "Wind Gusts"}
  ),
  convertTime = Table.TransformColumns(
    toTable,
    {{"Time", each #datetime(1970, 1, 1, 0, 0, 0) + #duration(0, 0, 0, _), type datetime}}
  ),
  changedType = Table.TransformColumnTypes(
    convertTime,
    {
      {"Wind Gusts", type number},
      {"Wind Speed", type number},
      {"Rain", type number},
      {"Temperature", type number}
    }
  )
in
  changedType
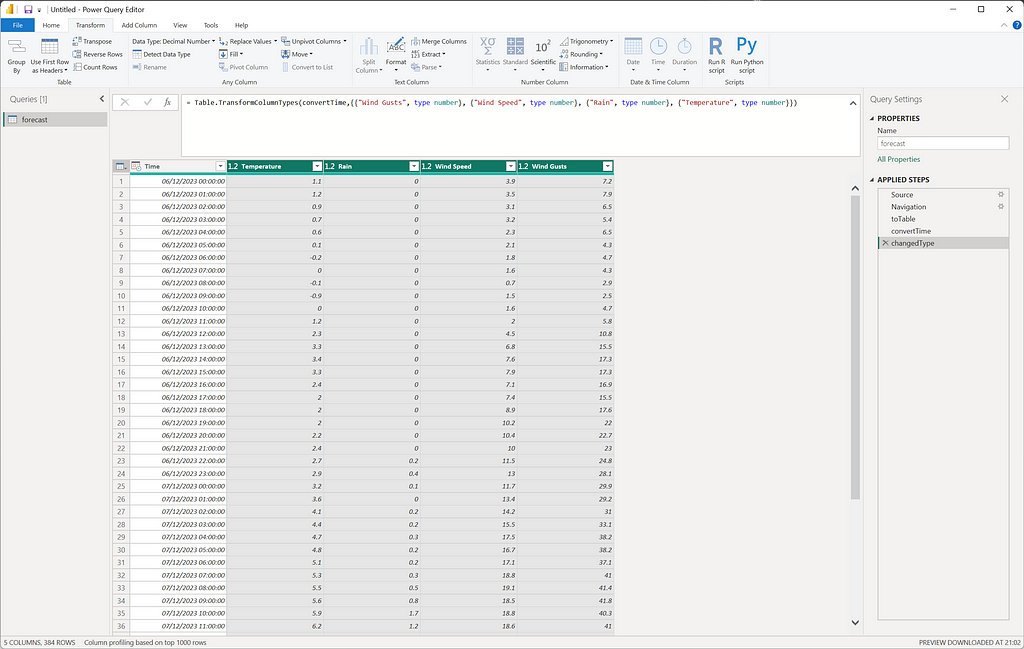
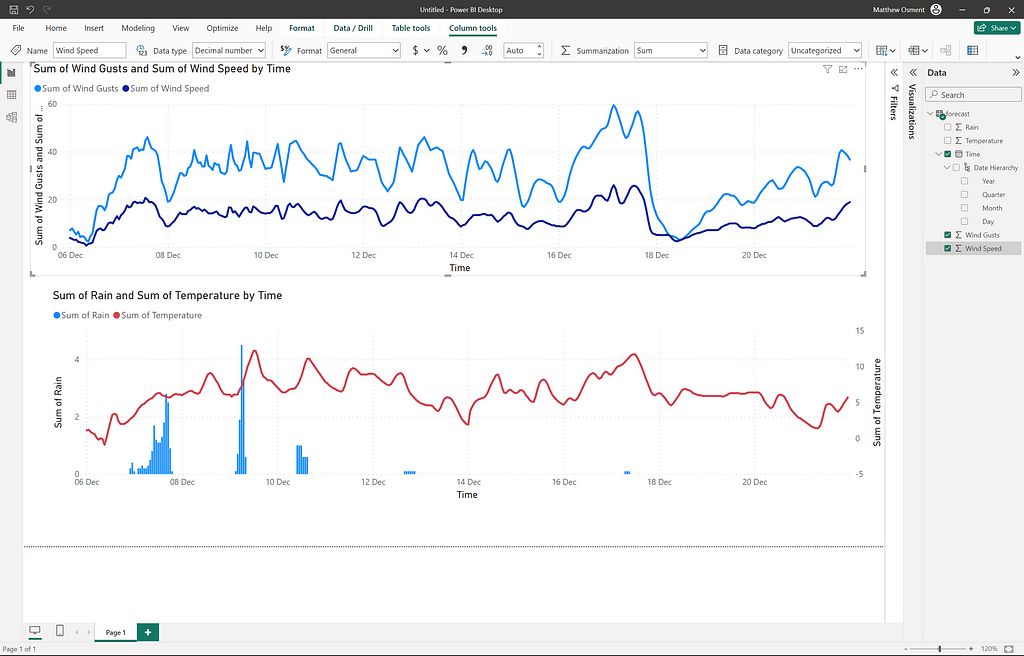
Then lets bring that into a series of visuals so we can make sure it looks like what we were seeing on the website before.
Now that we have our forecast data we want to grab our historical data. Since my plan is to turn this into a single function I’ll need to do it all in the same query as the previous step. Lucky for me the schema is identical so all I need to do is start with the second endpoint:
https://archive-api.open-meteo.com/v1/archive
Note: I found as I was doing this that I had a gap of 2 days between the historic data and the forecast. Looking at the Open-Meteo documentation it seems as though they don’t update their archive immediately, so instead you need to go back six days on the forecast API, which I have updatedin the query below.
let
  Source = Json.Document(
    Web.Contents(
      "https://api.open-meteo.com/v1/forecast?latitude=52.489471&longitude=-1.898575&hourly=temperature_2m,rain,wind_speed_10m,wind_gusts_10m&forecast_days=16&timeformat=unixtime&past_days=2",
      [Headers = [#"Accept-Encoding" = "gzip"]]
    )
  ),
  hourly = Source[hourly],
  toTable = Table.FromColumns(
    {
      hourly[time],
      hourly[temperature_2m],
      hourly[rain],
      hourly[wind_speed_10m],
      hourly[wind_gusts_10m]
    },
    {"Time", "Temperature", "Rain", "Wind Speed", "Wind Gusts"}
  ),
  convertTime = Table.TransformColumns(
    toTable,
    {{"Time", each #datetime(1970, 1, 1, 0, 0, 0) + #duration(0, 0, 0, _), type datetime}}
  ),
  changedType = Table.TransformColumnTypes(
    convertTime,
    {
      {"Wind Gusts", type number},
      {"Wind Speed", type number},
      {"Rain", type number},
      {"Temperature", type number}
    }
  ),
  historicSource = Json.Document(
    Web.Contents(
      "https://archive-api.open-meteo.com/v1/archive?latitude=52.489471&longitude=-1.898575&hourly=temperature_2m,rain,wind_speed_10m,wind_gusts_10m&start_date=2023-11-20&end_date=2023-12-04&timeformat=unixtime",
      [Headers = [#"Accept-Encoding" = "gzip"]]
    )
  ),
  historicHourly = historicSource[hourly],
  historicToTable = Table.FromColumns(
    {
      historicHourly[time],
      historicHourly[temperature_2m],
      historicHourly[rain],
      historicHourly[wind_speed_10m],
      historicHourly[wind_gusts_10m]
    },
    {"Time", "Temperature", "Rain", "Wind Speed", "Wind Gusts"}
  ),
  historicConvertTime = Table.TransformColumns(
    historicToTable,
    {{"Time", each #datetime(1970, 1, 1, 0, 0, 0) + #duration(0, 0, 0, _), type datetime}}
  ),
  historicChangedType = Table.TransformColumnTypes(
    historicConvertTime,
    {
      {"Wind Gusts", type number},
      {"Wind Speed", type number},
      {"Rain", type number},
      {"Temperature", type number}
    }
  ),
  combineTables = Table.Combine({historicChangedType, changedType}),
  removedDuplicates = Table.Distinct(combineTables, {"Time"})
in
  removedDuplicates
To fully operationalise this into a function for all our projects, we need to follow a few more steps:
- Determine the date on which the query is executed.
- Retrieve historical data starting from 180 days prior to today and ending 2 days before today, establishing a six-month rolling archive.
- Designate latitude and longitude as variables within the function.
- Import the project list from Excel. For this exercise, we’re using a local file, but this could be adapted to a Sharepoint list or an API call to an Enterprise Resource Planning (ERP) system.
- Execute the function for each project line.
let
  // Define the function
  FetchWeatherData = (latitude as number, longitude as number) as table =>
    let
      // Calculate the date range for historical data
      endDate = Date.AddDays(DateTime.Date(DateTime.LocalNow()), - 2),
      startDate = Date.AddDays(endDate, - 180),
      endDateText = Date.ToText(endDate, "yyyy-MM-dd"),
      startDateText = Date.ToText(startDate, "yyyy-MM-dd"),
      // Current weather data API call
      currentSource = Json.Document(
        Web.Contents(
          "https://api.open-meteo.com/v1/forecast?latitude="
            & Text.From(latitude)
            & "&longitude="
            & Text.From(longitude)
            & "&hourly=temperature_2m,rain,wind_speed_10m,wind_gusts_10m&forecast_days=16&timeformat=unixtime&past_days=2",
          [Headers = [#"Accept-Encoding" = "gzip"]]
        )
      ),
      currentHourly = currentSource[hourly],
      currentToTable = Table.FromColumns(
        {
          currentHourly[time],
          currentHourly[temperature_2m],
          currentHourly[rain],
          currentHourly[wind_speed_10m],
          currentHourly[wind_gusts_10m]
        },
        {"Time", "Temperature", "Rain", "Wind Speed", "Wind Gusts"}
      ),
      currentConvertTime = Table.TransformColumns(
        currentToTable,
        {{"Time", each #datetime(1970, 1, 1, 0, 0, 0) + #duration(0, 0, 0, _), type datetime}}
      ),
      currentChangedType = Table.TransformColumnTypes(
        currentConvertTime,
        {
          {"Wind Gusts", type number},
          {"Wind Speed", type number},
          {"Rain", type number},
          {"Temperature", type number}
        }
      ),
      // Historical weather data API call
      historicSource = Json.Document(
        Web.Contents(
          "https://archive-api.open-meteo.com/v1/archive?latitude="
            & Text.From(latitude)
            & "&longitude="
            & Text.From(longitude)
            & "&hourly=temperature_2m,rain,wind_speed_10m,wind_gusts_10m&start_date="&startDateText&"&end_date="&endDateText&"&timeformat=unixtime",
          [Headers = [#"Accept-Encoding" = "gzip"]]
        )
      ),
      historicHourly = historicSource[hourly],
      historicToTable = Table.FromColumns(
        {
          historicHourly[time],
          historicHourly[temperature_2m],
          historicHourly[rain],
          historicHourly[wind_speed_10m],
          historicHourly[wind_gusts_10m]
        },
        {"Time", "Temperature", "Rain", "Wind Speed", "Wind Gusts"}
      ),
      historicConvertTime = Table.TransformColumns(
        historicToTable,
        {{"Time", each #datetime(1970, 1, 1, 0, 0, 0) + #duration(0, 0, 0, _), type datetime}}
      ),
      historicChangedType = Table.TransformColumnTypes(
        historicConvertTime,
        {
          {"Wind Gusts", type number},
          {"Wind Speed", type number},
          {"Rain", type number},
          {"Temperature", type number}
        }
      ),
      // Combine and clean the data
      combineTables = Table.Combine({historicChangedType, currentChangedType}),
      removedDuplicates = Table.Distinct(combineTables, {"Time"})
    in
      removedDuplicates
in
  FetchWeatherData
let
Source = Excel.Workbook(File.Contents("G:\My Drive\Projects\Weather Dashboard\Locations.xlsx"), null, true),
Table1_Table = Source{[Item="Table1",Kind="Table"]}[Data],
#"Changed Type" = Table.TransformColumnTypes(Table1_Table,{{"Latitude", type number}, {"Longitude", type number}}),
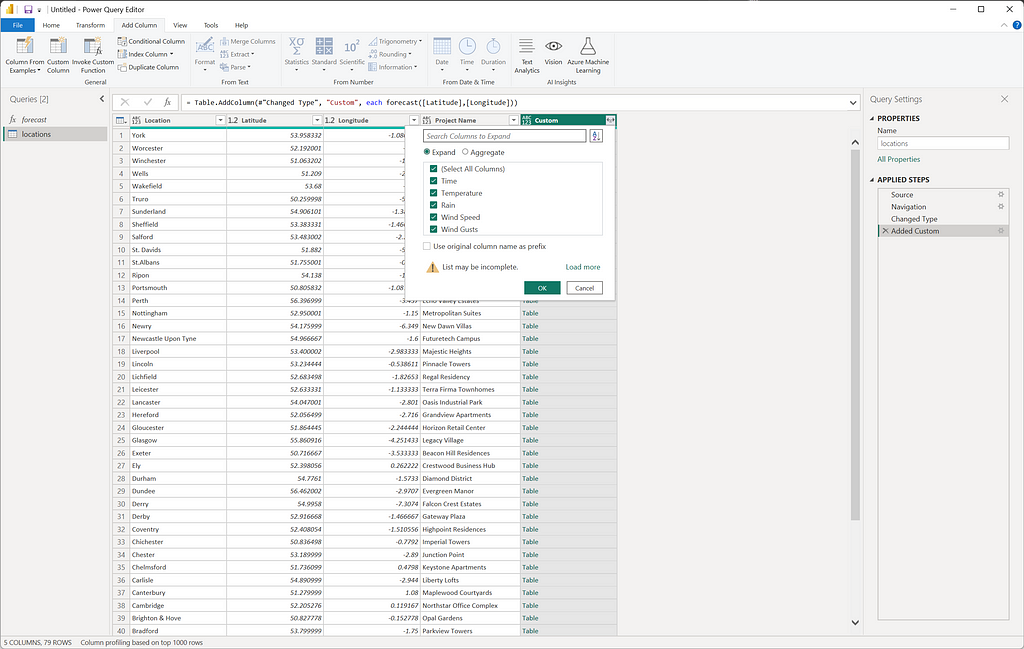
#"Added Custom" = Table.AddColumn(#"Changed Type", "Custom", each forecast([Latitude],[Longitude])),
#"Expanded Custom" = Table.ExpandTableColumn(#"Added Custom", "Custom", {"Time", "Temperature", "Rain", "Wind Speed", "Wind Gusts"}, {"Time", "Temperature", "Rain", "Wind Speed", "Wind Gusts"}),
#"Changed Type1" = Table.TransformColumnTypes(#"Expanded Custom",{{"Temperature", type number}, {"Rain", type number}, {"Wind Speed", type number}, {"Wind Gusts", type number}, {"Time", type datetime}}),
#"Sorted Rows" = Table.Sort(#"Changed Type1",{{"Time", Order.Ascending}})
in
#"Sorted Rows"
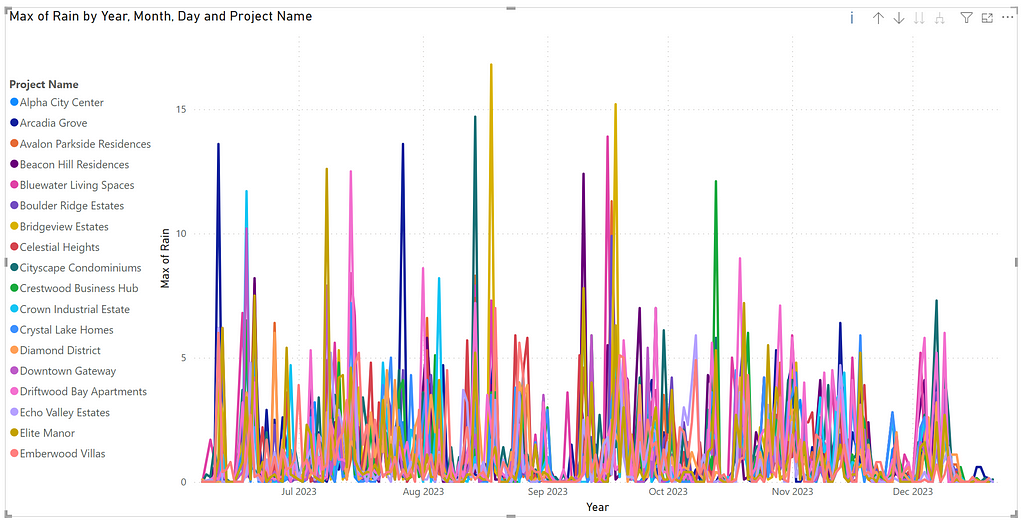
Which means we get one table per location, and all that’s left to do then is expand each row.
What we end up with is a whole lot of colourful spaghetti, which is obviously not helpful to anyone.
The dashboard
Having gathered all the necessary data, we can now focus on how to effectively use it for decision-making. The primary step is to identify problematic weather conditions, especially wind, due to its significant impact on crane operations. Expanding this tool to include crane utilisation plans, and comparing these with wind forecasts and historical data, would allow us to predict whether upcoming wind conditions might be similar to those that previously halted crane operations.
One challenge here is the hyper-local nature of wind data. We rely on weather stations that might not be in close proximity to the actual site. However, by applying machine learning to weather forecasts and tracking our own data trends, we can achieve a high degree of accuracy.
For crane operations, the safe limit is typically around 40km/h. To incorporate a safety margin, setting a warning threshold at 32km/h seems prudent. Additionally, we should monitor for instances where wind gusts exceed 56km/h, creating a combined warning score to enhance safety and operational efficiency.
Wind Warning = ROUNDUP(IF(locations[Wind Speed]<32,0,locations[Wind Speed]-32)+IF(locations[Wind Gusts]<56,0,locations[Wind Gusts]-56),0)
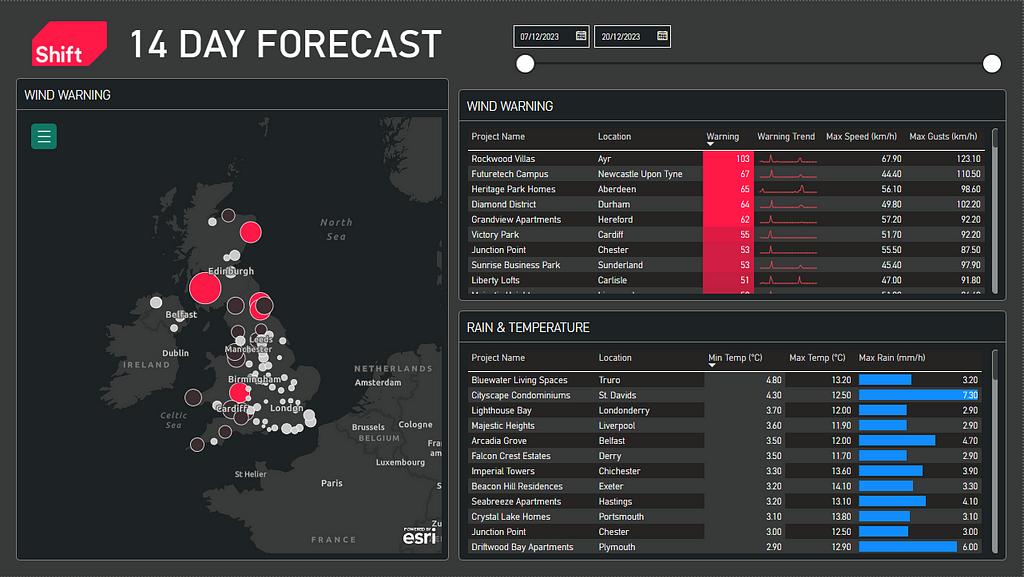
To facilitate calculations like maximum values or conditional formatting, using numerical data is more efficient. With the data now organised, we can set up the dashboard. In the example I created, the following visuals were used:
- Page Filter: This is set to limit the date range to greater than today, ensuring we focus only on the forecast, and less than 14 days from today, to keep the data relevant and up-to-date.
- ArcGIS Map: This feature plots individual project locations using latitude and longitude. The bubble size and colour on the map indicate the maximum weather warning level for each project during the selected time frame.
- Date Slider: This tool allows users to narrow down the data to specific date ranges, making it easier to focus on particular periods of interest.
- Wind Warning Table: This table displays wind warnings, ranked from highest to lowest. It includes sparklines to visualise sustained trends, providing a quick overview of wind conditions over time.
- Temperature and Rainfall Table: This table presents data on temperature and rainfall, which users can sort depending on the decisions they need to make.
Then I revisited the second page to neaten up the graphs and add a dropdown to select the project. This filter can be linked to the URL so each project can have a PowerBI dashboard embedded in their intranet page displaying the data for their specific project.
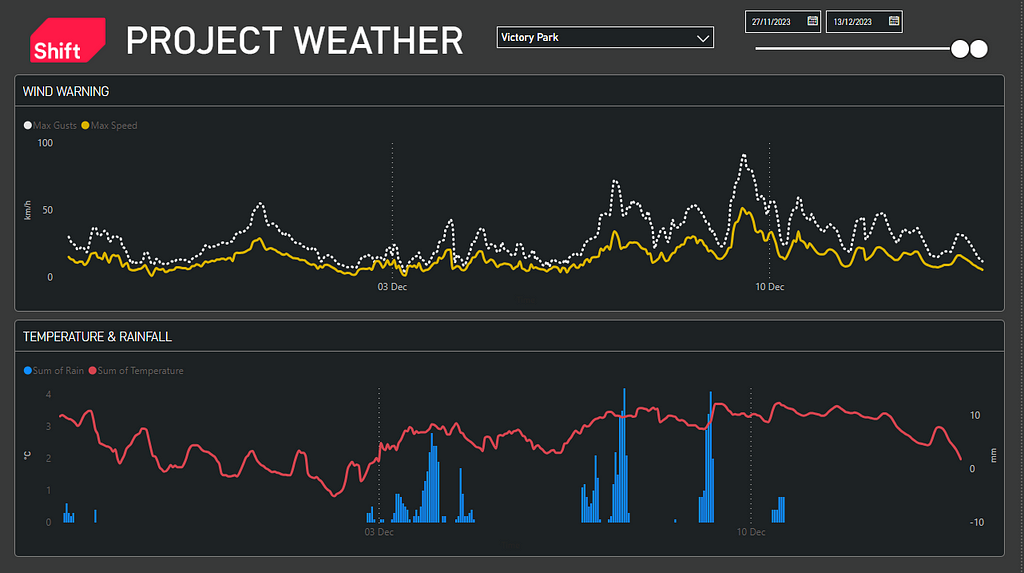
Now our team can see where any peaks in rainfall or wind are expected and plan accordingly. There’s so much we can do to expand on this concept like bringing in lifting plans as mentioned before, or linking to a schedule using the Shift PowerBI P6 XER Importer.
Here is a link to the final dashboard, although the map is currently disabled to avoid paying arcGIS unneccessarily.
As always subscribe to Shift on Medium to get articles straight to your email, or follow me and Shift on LinkedIn.
How to build an actionable weather dashboard (in an afternoon!) was originally published in Shift Construction on Medium, where people are continuing the conversation by highlighting and responding to this story.